Structure plots
The structure plots use Ploty's go.Scatter3d as their base. Unlike the previous two plot types, the structure plotting is handled by the structure3d plotting method, which is in turn wrapped by the Structure and Interaction plotting methods. These two methods leverage structure3d and its defaults to produce the structure plots we have seen earlier. It is however possible to bypass those structure plots if you don't have a .cif file or you want to write your own more general 3D plot.
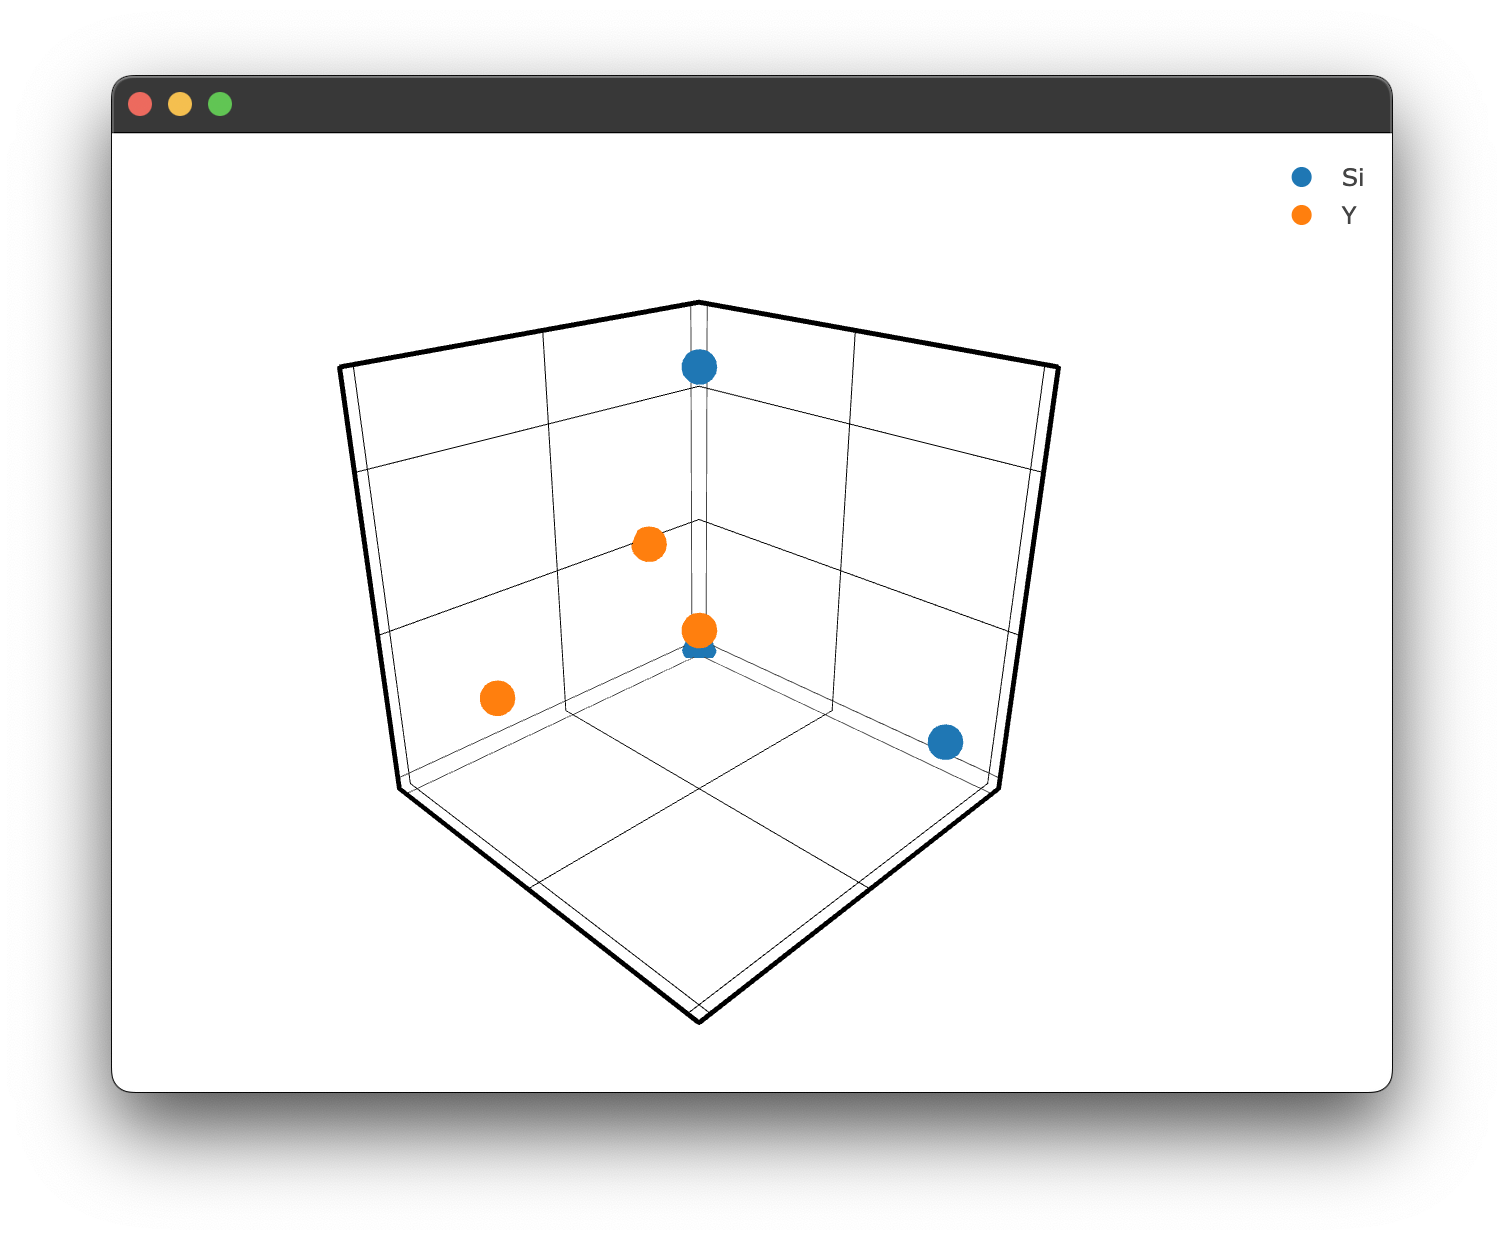
To create a 3D plot without using a .cif file and Structure.structure_plot() or Interaction.doped_structure_plot() we simply need to use the methods we used for the spectra & transient plot types:
figure = Plot()

figure.structure_3d([0,1,2],[0,5,2],[0,1,5], name = 'Si')
figure.structure_3d([5,1,1],[2,0,1],[2,2,1], name='Y')
figure.show()
which gives us the following figure: